Appearance
Data Pipelines and Analytics
Data Pipelines and Analytics Graphics Coverage
Primary chapter graphic: Data Lake Architecture Flow, Batch and Stream Processing Tradeoff. Accepted graphics: 2. Reviewed non-signal pages: 1. Open graphics in review: 0. QA status lives in graphics audit and visual review ledger.
Corpus pages: p. 125, p. 188-189, p. 351 Coverage: 4 pages; low-confidence extraction ranges: p. 351
This chapter is part of Marius's owned architecture build corpus. The text routes decisions; durable implementation signal is carried by accepted graphics, reviewed non-signal decisions, and the linked QA audit.
Chapter Visuals
Accepted graphics carry the canonical design signal for this chapter. Each selected source page is either accepted as a graphic or explicitly marked non-signal in the source-faithful ledger. Review and QA state live in visual inventory, visual review ledger, and graphics audit.
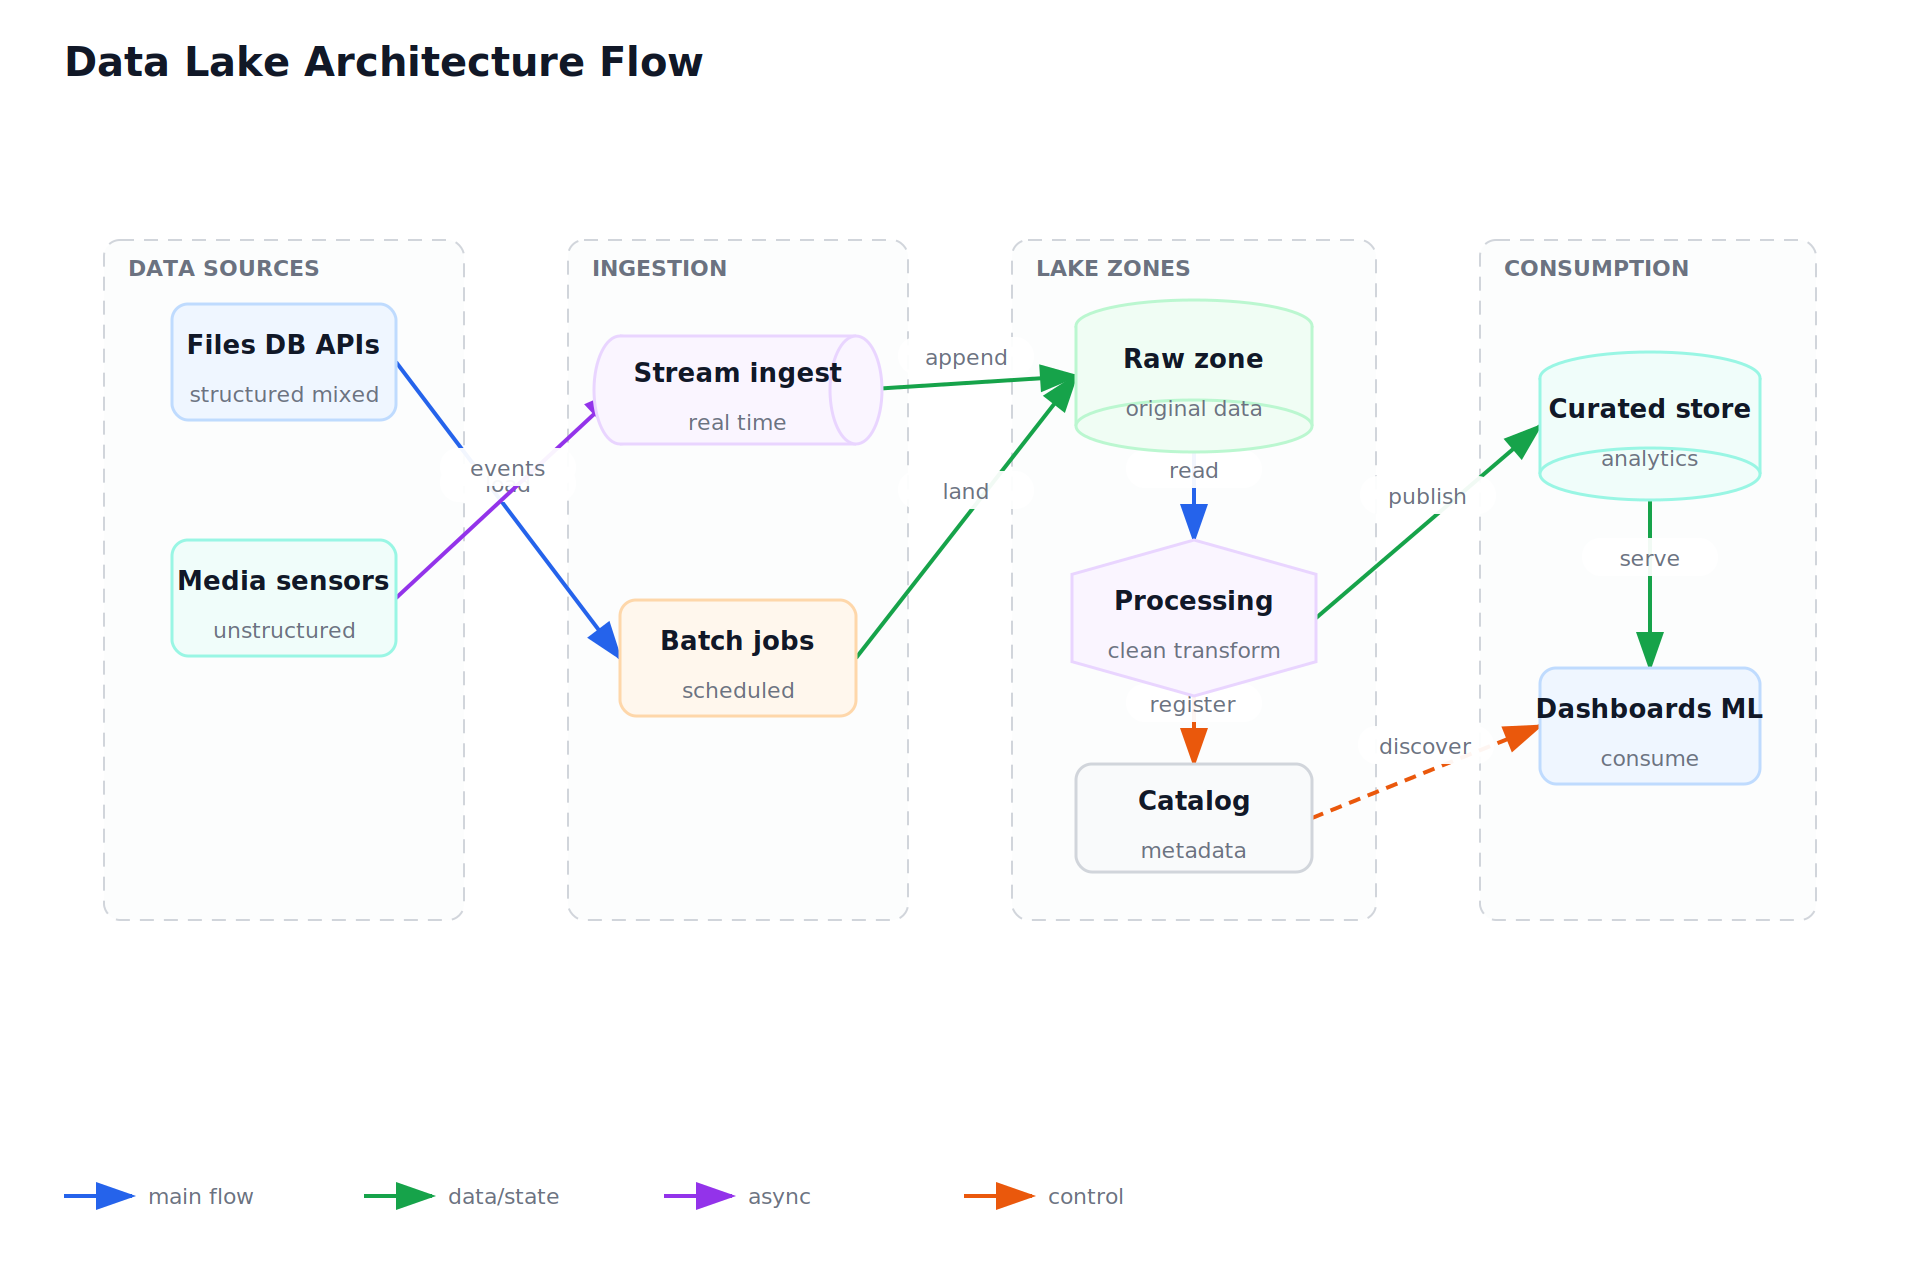
Data Lake Architecture Flow
- source-page: p. 188
- batch: 04
- status: accepted
- reviewer-status: reviewed
- fidelity-score: 0.9
- spec: bbg-p0188-data-pipelines-and-analytics-data.json
- svg: bbg-p0188-data-pipelines-and-analytics-data.svg
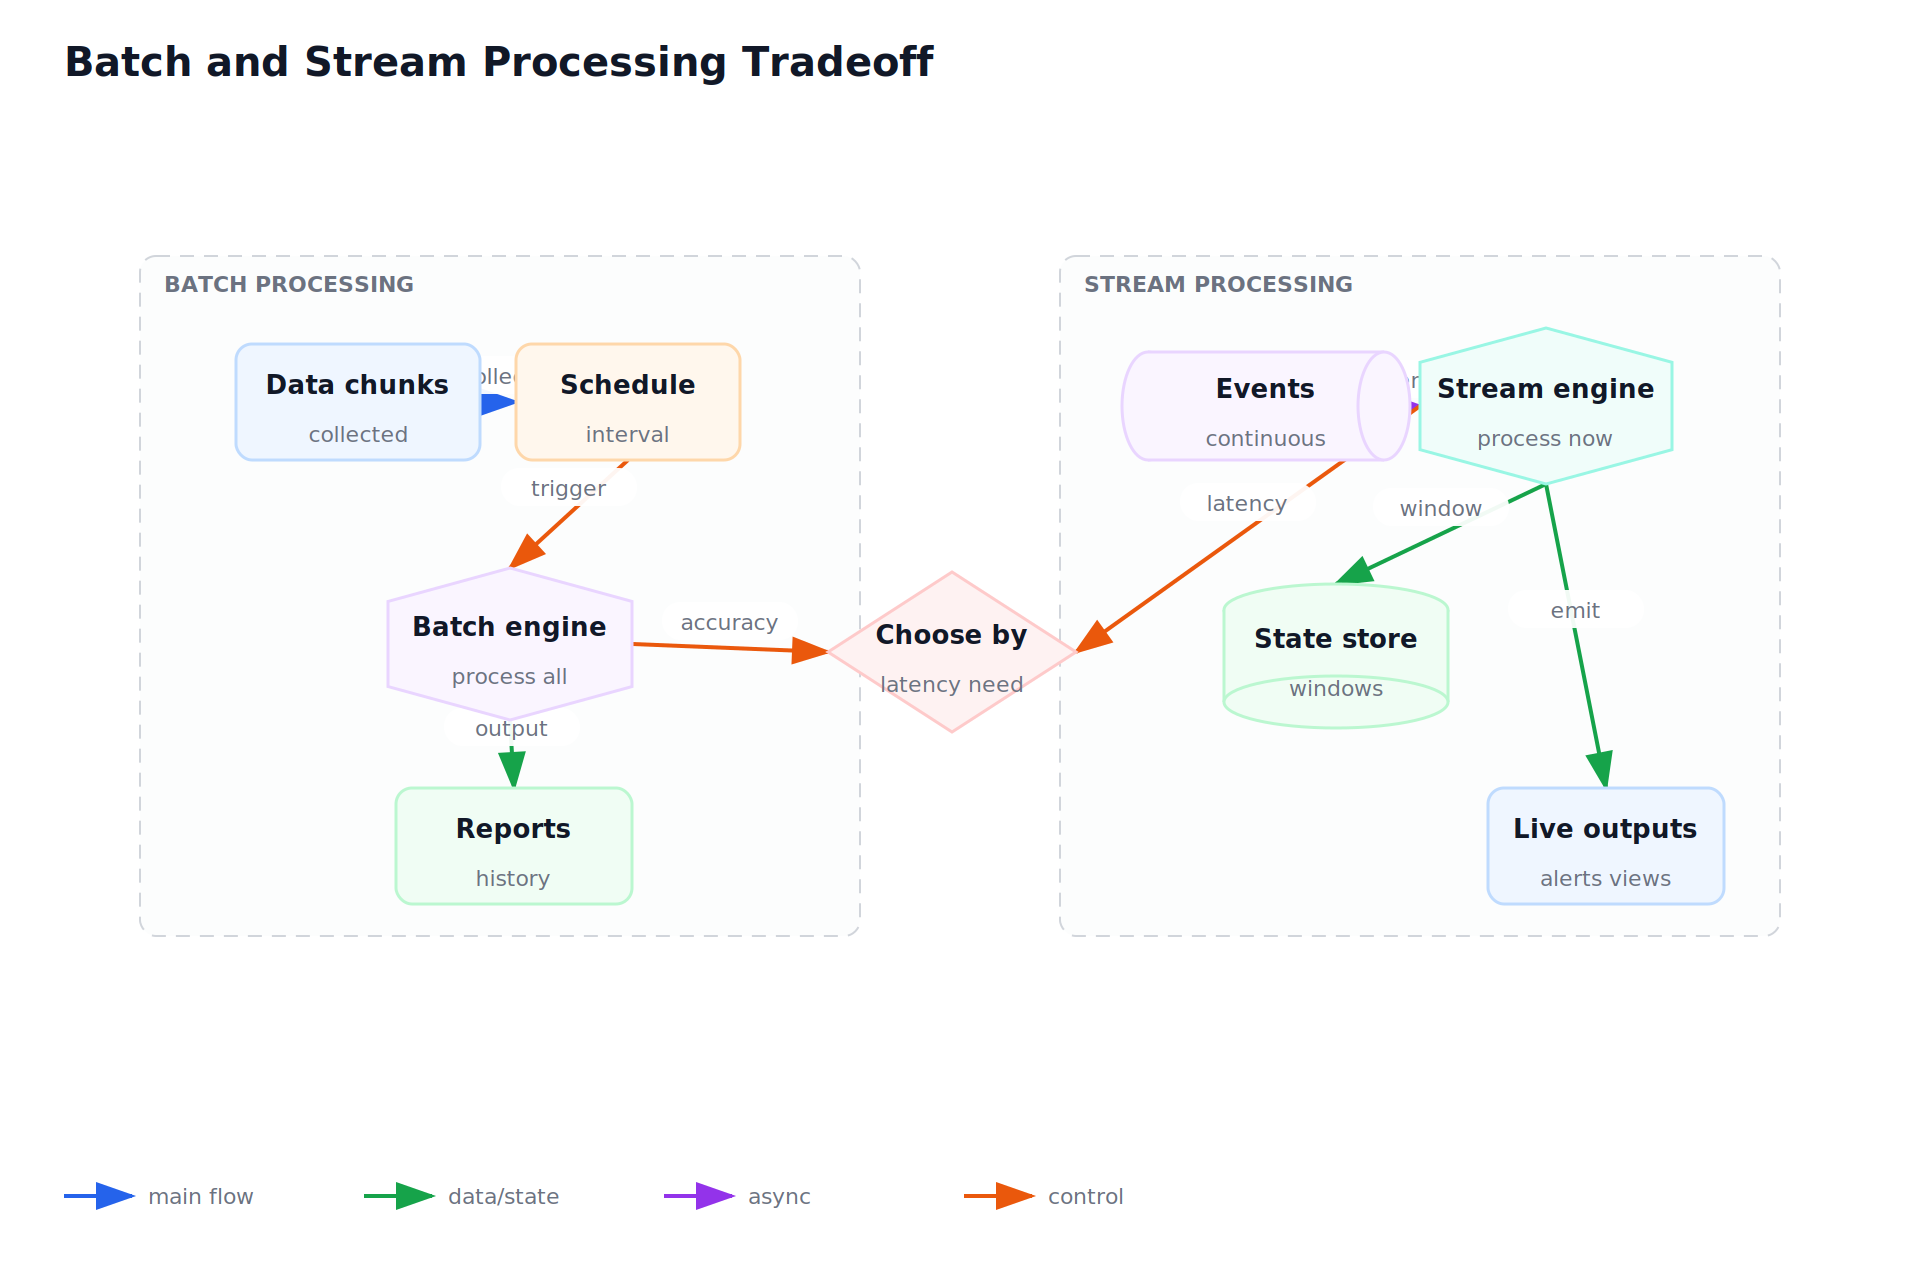
Batch and Stream Processing Tradeoff
- source-page: p. 351
- batch: 24
- status: accepted
- reviewer-status: reviewed
- fidelity-score: 0.9
- spec: bbg-p0351-data-pipelines-and-analytics-data.json
- svg: bbg-p0351-data-pipelines-and-analytics-data.svg
Open Review Queue
- none
Reviewed Non-Signal Pages
- Data Pipelines And Analytics: Stream + Database Map: source p. 125; batch 05; status non-signal/reviewed; ledger reason in visual-review-ledger.json
Use When
- Operational data needs to become reports, dashboards, models, or recurring analytical artifacts.
Avoid When
- The source data is not trusted or lacks ownership.
Core Model
- Pipelines move data through raw, cleaned, modeled, and served states with freshness and quality contracts.
- Prefer explicit ownership over accidental coupling. Every boundary should say who owns correctness, cost, data, recovery, and change.
- Use corpus page pointers for inspection, and keep the chapter notes focused on reusable design decisions.
Implementation Guidance
- Define source, ingestion mode, transformation rules, quality checks, backfill strategy, and serving model.
- Write the smallest useful design note: purpose, inputs, outputs, state, failure behavior, observability, and rollback.
- Choose the first implementation that can be tested against the real workflow without hiding a known production risk.
Tradeoffs
- Batch jobs simplify correctness; streaming improves freshness at higher operational cost.
- Centralization reduces duplicated work but can become a bottleneck when every team needs exceptions.
- Specialized infrastructure helps at scale, but it must earn its operational cost.
Failure Modes
- A dashboard becomes the only place where metric logic exists.
- The diagram shows boxes but not ownership, retry behavior, data freshness, or user-visible failure.
- The system has no proof path for the highest-risk assumption.
Decision Checklist
- Track lineage, freshness, schema drift, failed loads, and backfill coverage.
- Name the owner, source of truth, timeout, retry policy, and evidence that the path works.
- Add one regression check for the failure mode most likely to recur.
Neutral Automation Examples
- A sales dashboard materializes daily facts from operational events and labels every chart with its refresh time.
- A neutral internal automation starts with fixtures, then adds credentials, permissions, and production scheduling only after the boundary is tested.
- A customer-facing workflow keeps irreversible actions behind explicit approval until metrics show it is safe to automate further.