Appearance
Frontend Architecture and Performance
Frontend Architecture and Performance Graphics Coverage
Primary chapter graphic: Frontend Performance Control Map, Large Frontend Monorepo Topology. Accepted graphics: 2. Reviewed non-signal pages: 1. Open graphics in review: 0. QA status lives in graphics audit and visual review ledger.
Corpus pages: p. 28-29, p. 91-92, p. 442 Coverage: 5 pages
This chapter is part of Marius's owned architecture build corpus. The text routes decisions; durable implementation signal is carried by accepted graphics, reviewed non-signal decisions, and the linked QA audit.
Chapter Visuals
Accepted graphics carry the canonical design signal for this chapter. Each selected source page is either accepted as a graphic or explicitly marked non-signal in the source-faithful ledger. Review and QA state live in visual inventory, visual review ledger, and graphics audit.
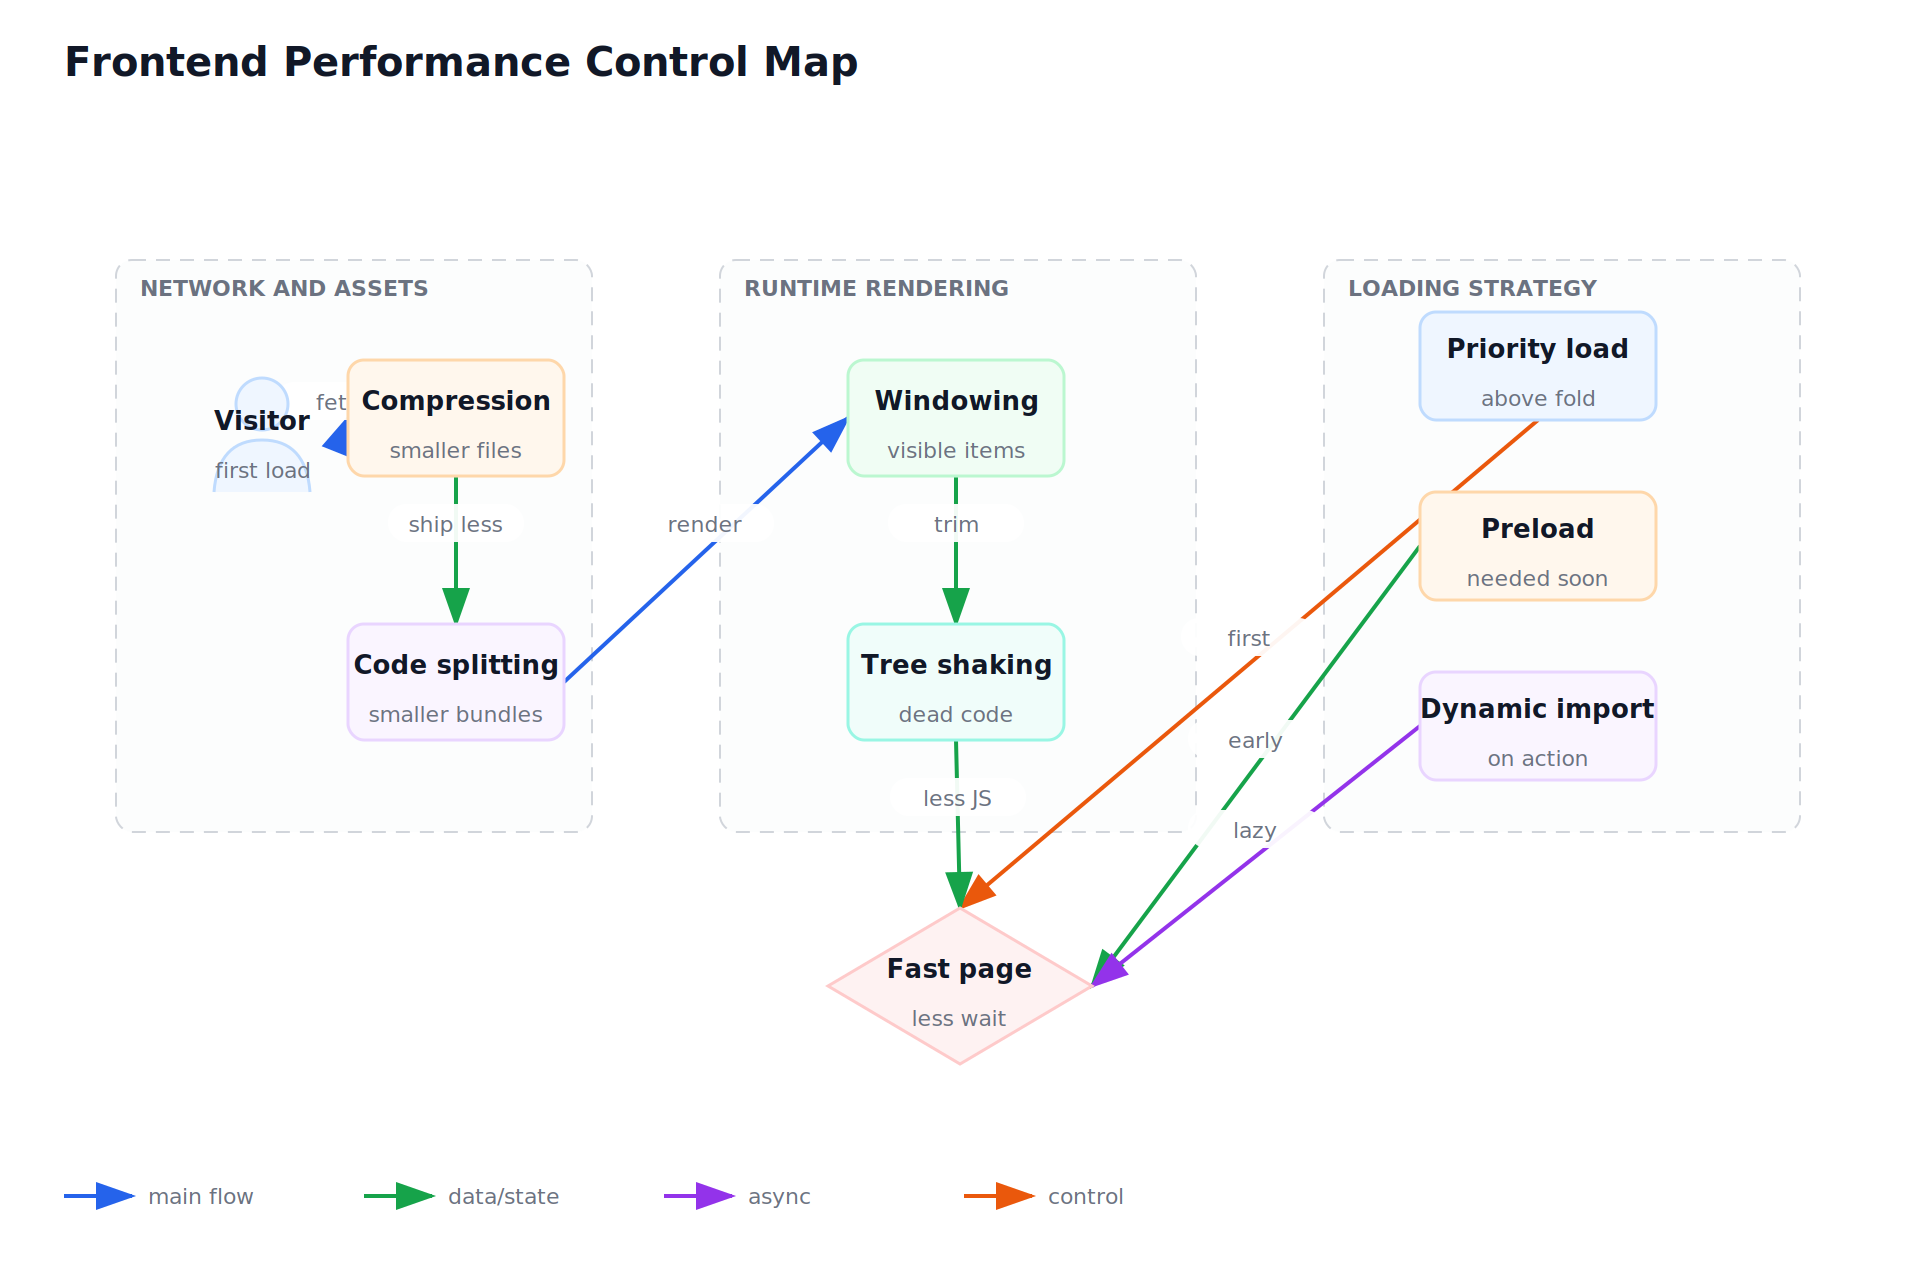
Frontend Performance Control Map
- source-page: p. 91
- batch: 27
- status: accepted
- reviewer-status: reviewed
- fidelity-score: 0.9
- spec: bbg-p0091-frontend-architecture-performance-frontend-architecture.json
- svg: bbg-p0091-frontend-architecture-performance-frontend-architecture.svg
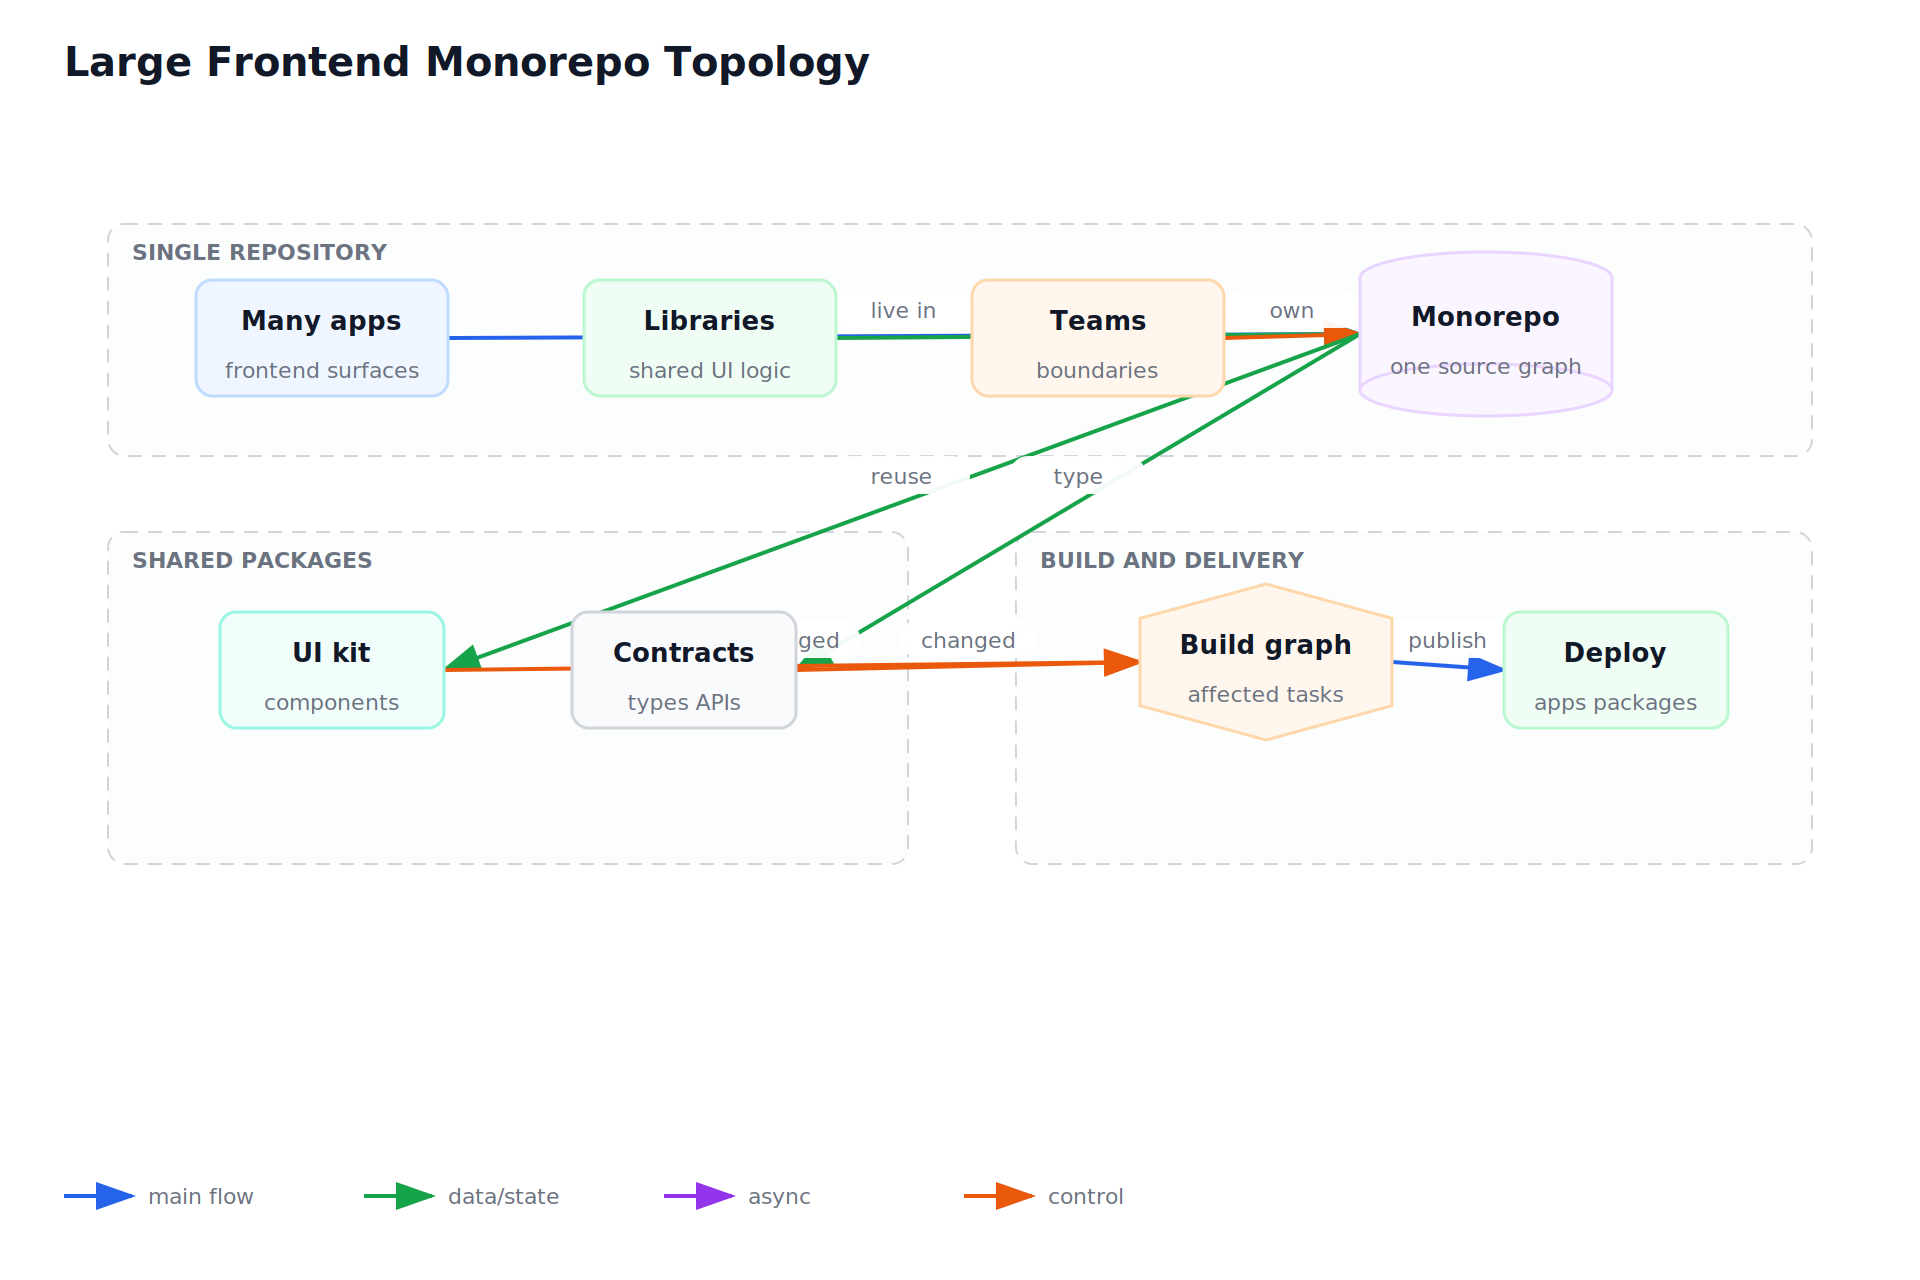
Large Frontend Monorepo Topology
- source-page: p. 28
- batch: 29
- status: accepted
- reviewer-status: reviewed
- fidelity-score: 0.9
- spec: bbg-p0028-frontend-architecture-performance-frontend-architecture.json
- svg: bbg-p0028-frontend-architecture-performance-frontend-architecture.svg
Open Review Queue
- none
Reviewed Non-Signal Pages
- Frontend Architecture And Performance: Cache + Port Map: source p. 92; batch 35; status non-signal/reviewed; ledger reason in visual-review-ledger.json
Use When
- Browser experience, bundle size, dependency shape, or frontend delivery affects users.
Avoid When
- The bottleneck is a backend query or external API call.
Core Model
- Frontend architecture controls what code, data, and assets the browser must fetch before the user can act.
- Prefer explicit ownership over accidental coupling. Every boundary should say who owns correctness, cost, data, recovery, and change.
- Use corpus page pointers for inspection, and keep the chapter notes focused on reusable design decisions.
Implementation Guidance
- Measure route bundles, split by user journey, cache stable assets, and keep dependencies visible.
- Write the smallest useful design note: purpose, inputs, outputs, state, failure behavior, observability, and rollback.
- Choose the first implementation that can be tested against the real workflow without hiding a known production risk.
Tradeoffs
- Splitting reduces initial load but can create waterfall fetches if boundaries are poorly chosen.
- Centralization reduces duplicated work but can become a bottleneck when every team needs exceptions.
- Specialized infrastructure helps at scale, but it must earn its operational cost.
Failure Modes
- A shared dependency change silently inflates every route bundle.
- The diagram shows boxes but not ownership, retry behavior, data freshness, or user-visible failure.
- The system has no proof path for the highest-risk assumption.
Decision Checklist
- Track first load size, critical path requests, cache headers, hydration work, and route-level errors.
- Name the owner, source of truth, timeout, retry policy, and evidence that the path works.
- Add one regression check for the failure mode most likely to recur.
Neutral Automation Examples
- An admin dashboard lazy-loads heavy chart code while keeping navigation and filters immediately interactive.
- A neutral internal automation starts with fixtures, then adds credentials, permissions, and production scheduling only after the boundary is tested.
- A customer-facing workflow keeps irreversible actions behind explicit approval until metrics show it is safe to automate further.